This week I had the dubius honor of trying to find out why a native subsystem of PSPDFKit is performing orders of magnituted slower than it should. As it turns out, NDK tooling on Android is exceptionally bad.
A quick Google search found two ways of profiling NDK code running on an Android device:
1. Using android-ndk-profiler project from GitHub.
This project provides missing gnu_mcount method implementation needed by -pg compile flag instrumentation. For some reason GCC in NDK doesn't emit it at all. With -pg enabled you can then extract the gprof data from the device and use standard Linux gprof tooling to analyze perfromance hotspots.
Unfortunately our code has to be built with clang compiler and the LLVM profiling code generation is utterly broken for -pg. So this option was out.
2. Using android_ndk_perf by Google (part of fplutil)
Google recently released a Python NDK profling script that uses Linux kernel instrumentation calls to measure performance. This requires kernel support and currently only two devices are whitelisted as supported in the Python script - Nexus 7 2012 and Nexus 10. Nexus 5 and 7 2013 are explicitly marked as “broken”. Unfortunately, even on a “supported” device this instrumentation did not work at all. It required me to pass in an APK from the app and then happily failed with a full console of Permission denied errors. I guess the issue was that my Nexus 7 was updated to Android 5.0 which changed permissions or implementation of instrumentation calls. I didn't want to spend several days reflashing the Nexus with different Android versions to find the right one.
3. Using Tegra System Profiler
After hours of Googling I've found the last option - using the nVidia Tegra System Profiler. It requires a rather modern Tegra device - good thing I had a Nexus 9 handy. The profiler itself was also sensitive to software running on the device - the final winning combination was:
- Nexus 9 with Android 5.1.1 image.
- Rooted with SuperSU (full profiling support requires a rooted device).
- Native project had to include
armeabi-v7abinaries, symbolification forarm64-v8awas worse. - Connection via USB. Even though Tegra profiler supports wifi ADB connections
This actually gave me partially useful results and I was able to track down the perfromance regression. Even Tegra profiler couldn't fully unwind all traces connected to libdispatch library we're using - I'm figuring that -fblocks compiler parameter implements blocks in a way that's not recognised by the stack unwinder.
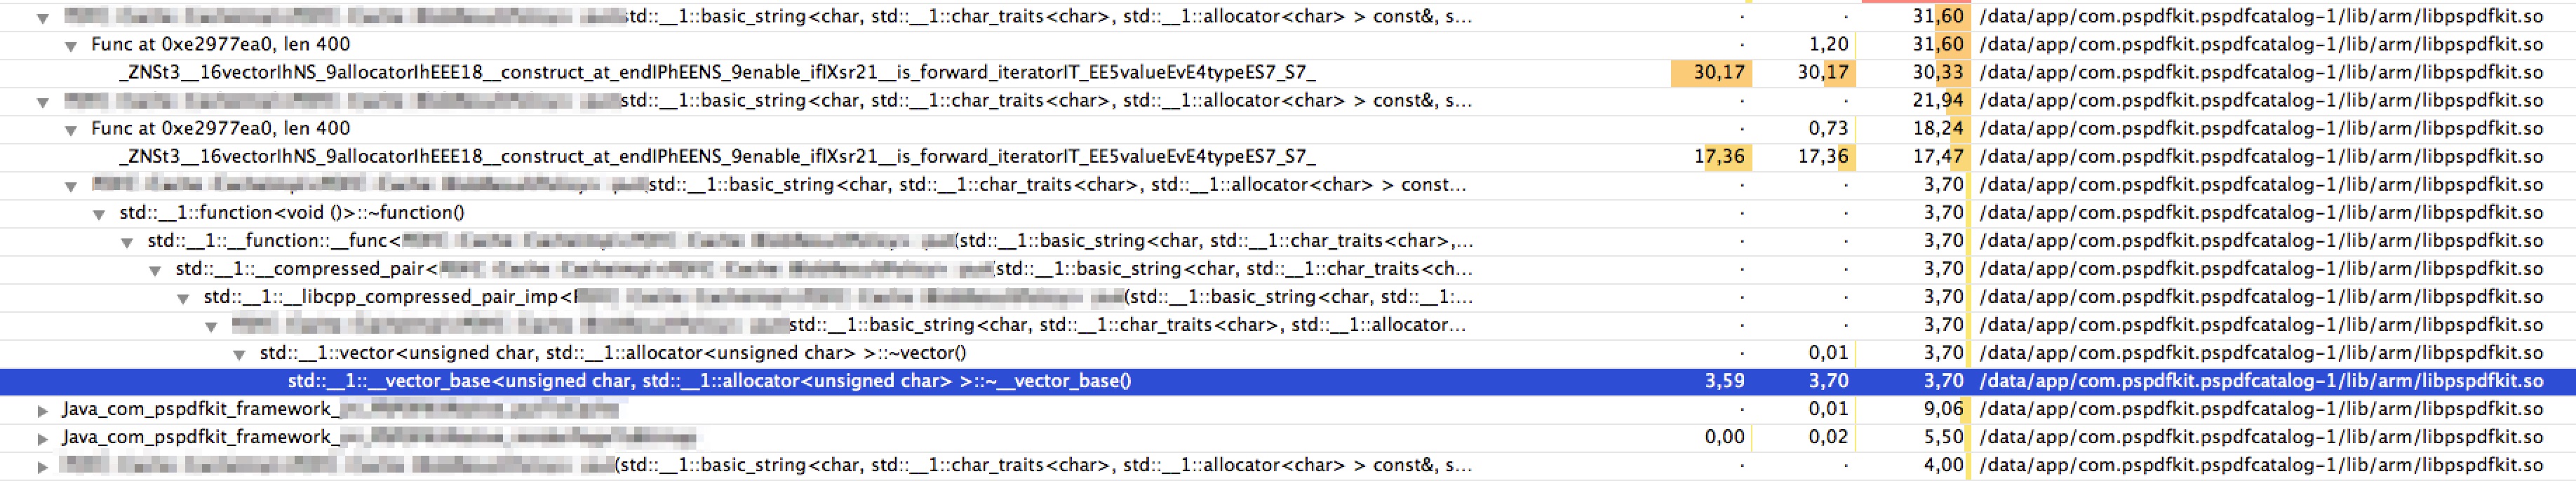
Tegra profiler example
I hope Google improves their NDK tools soon - lack of basic profilers and code checkers makes Android native development needlessly time consuming and complex.